Garbage: The Newest Economic Indicator?
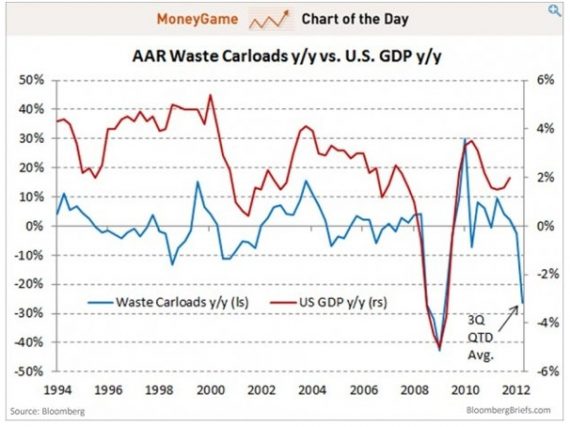
Chris Cillizza passes along this interesting chart from Michael McDonough, an economist currently working for Deutsche Bank, that compares the volume of trash in the United States with Gross Domestic Product:
It’s certainly an interesting correlation, and as Cillizza notes, the current direction of the carloads of waste line does not bode well for GDP. It does make some intuitive sense. If the economy is weak or contracting, less economic activity is going to lead to less waste produced. On the other hand, a booming economy is likely to lead to increased waste production.
If there’s a true correlation here, then we are potentially headed for a period of negative economic growth heading into the Third Quarter. Some people call that a recession.


The obvious problem with this is the rise of recycling and there would have to be some scale for how packaging has changed.
Sure, it seems like a good indicator. Garbage looks more volatile than GDP though, and the coincidental convergence on the 2009 bottom gives the thing kind of a false feel. It isn’t really one to one.
He’s a bit behind the curve on this one. I posted on it a week ago. In comments someone made a good point: a considerable proportion of the waste transported by rail consists of industrial waste from steel companies. The divergence between GDP and cars of transported waste is at least in part a measure of our continuing transition to a post-industrial economy.
Correction: I posted on it five days ago.
It was 42% from iron and steel. My musings on this were that this is not representative of overall waste generation in America. Waste hauled by rail is substantially underrepresentative of household waste and consturction/demolition debris. The health of the iron and steel industry is highly corrolated with GDP, second only to waste.
Maybe we have less trash because we have more hobos picking up trash. So there’s the bright side!
One man’s trash is another man’s blog post.