Trump’s Job Approval
It's down, but relatively steady.

AP polling editor Amelia Thomson-Deveaux and politics reporter Jonathan J. Cooper find, “It’s a year of rapid change, except when it comes to Trump’s approval numbers.”
Eric Hildenbrand has noticed prices continue to rise this year, even with President Donald Trump in the White House. He doesn’t blame Trump, his choice for president in 2024, but says Gov. Gavin Newsom and other Democrats who control his home state, California, are at fault.
“You can’t compare California with the rest of the country,” said Hildenbrand, who is 76 and lives in San Diego. “I don’t know what’s going on in the rest of the country. It seems like prices are dropping. Things are getting better, but I don’t necessarily see it here.”
Voters like Hildenbrand, whose support of the Republican president is unwavering, help explain Trump’s polling numbers and how they have differed from other presidents’ polling trajectory in significant ways. An Associated Press-NORC Center for Public Affairs Research poll conducted in March found that 42% of U.S. adults approved of Trump’s job performance. That is a lower rating than those of other recent presidents at the beginning of their second terms, including Democrat Barack Obama and Republican George W. Bush.
The most recent AP-NORC poll, from July, puts Trump at 40% approval. While that is not a meaningful change from March, there is some evidence that Trump’s support may be softening, at least on the margins. The July poll showed a slight decrease in approval of his handling of immigration since earlier in the year. Some other pollsters, such as Gallup, show a downward slide in overall approval since slightly earlier in his term, in January.
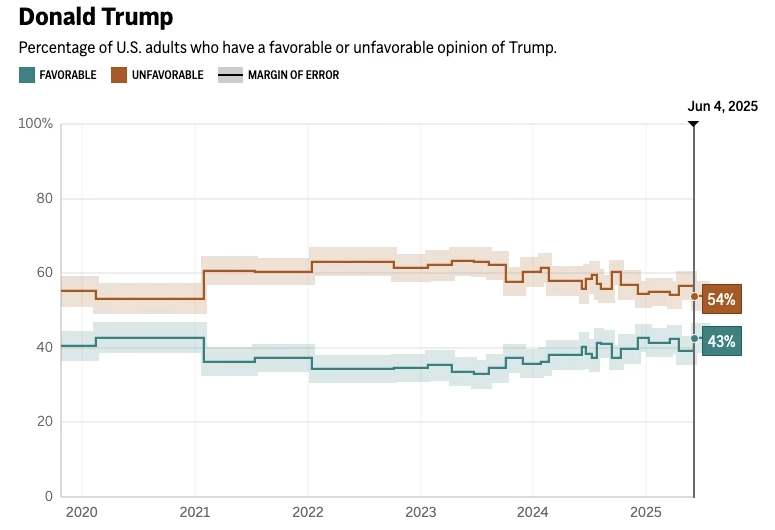
But even those shifts are within a relatively narrow range, which is typical for Trump. The new AP-NORC polling tracker shows that Trump’s favorability rating has remained largely steady since the end of his first term, with between 33% and 43% of U.S. adults saying they viewed him favorably across more than five years.
Those long-term trends underscore that Trump has many steadfast opponents. But loyal supporters also help explain why views of the president are hard to change even as he pursues policies that most Americans do not support, using an approach that many find abrasive.
Trump has not had a traditional honeymoon period in his second term. He did not in his first, either.
An AP-NORC poll conducted in March 2017, two months into his first term, showed that 42% of Americans “somewhat” or “strongly” approved of his performance. That is largely where his approval rating stayed over the course of the next four years.
The recent slippage on immigration is particularly significant because that issue was a major strength for Trump in the 2024 election. Earlier in his second term, it was also one of the few areas where he was outperforming his overall approval. In March, about half of U.S. adults approved of his handling of immigration. But the July AP-NORC poll found his approval on immigration at 43%, in line with his overall approval rating.
Their thesis, that Trump’s approval is anchored by steadfast supporters and opponents, is almost certainly correct. This graph of their own poll is remarkable:
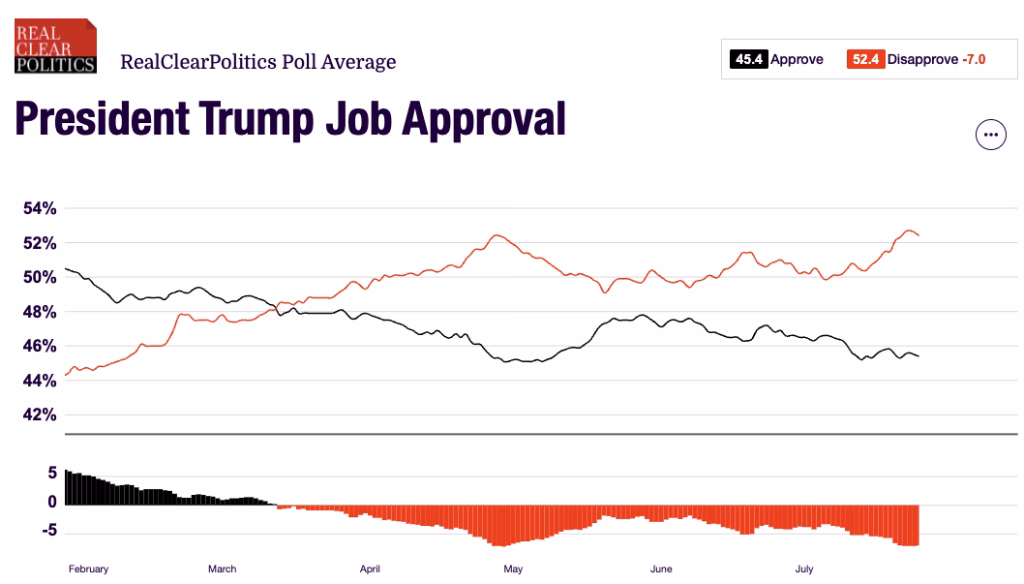
That said, there’s a reason poll aggregators have become more popular over the last twenty years. While imperfect, they tend to smooth out irregularities and biases of individual polling firms, or simply outlier surveys. Here’s what RealClearPolitics shows for Trump’s second term thus far:
And this was his entire first term:
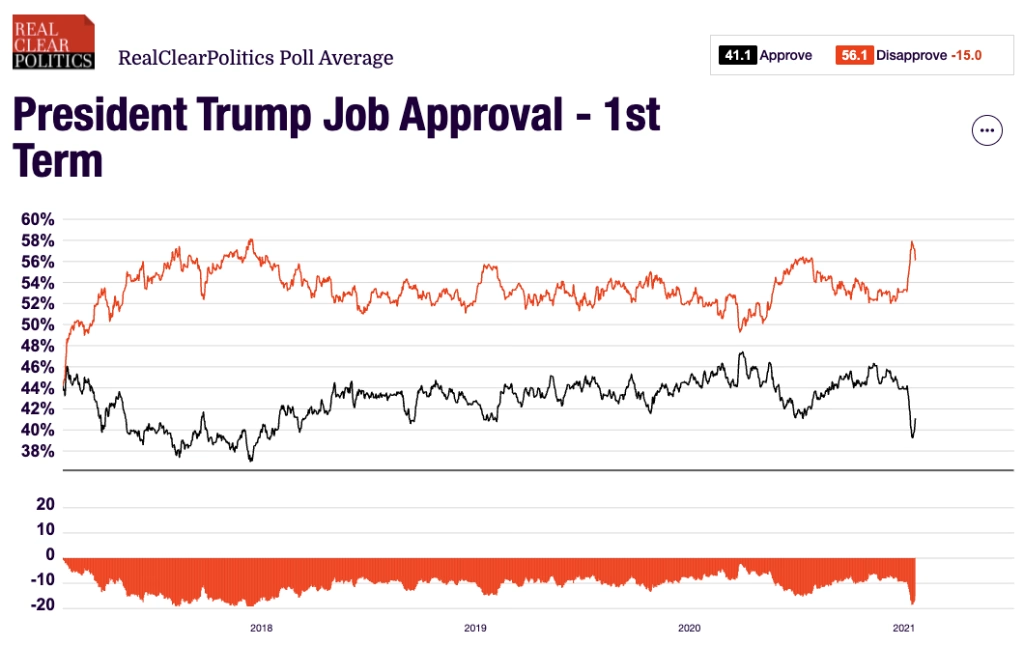
So, with the exception of the first couple days of his first term and first few weeks of his second term, he’s been underwater. But there has nonetheless been rather considerable, if bounded, fluctuation in his numbers.
But, as much as Trump would seem sui generis, here’s the RCP trends for President Biden’s entire term:
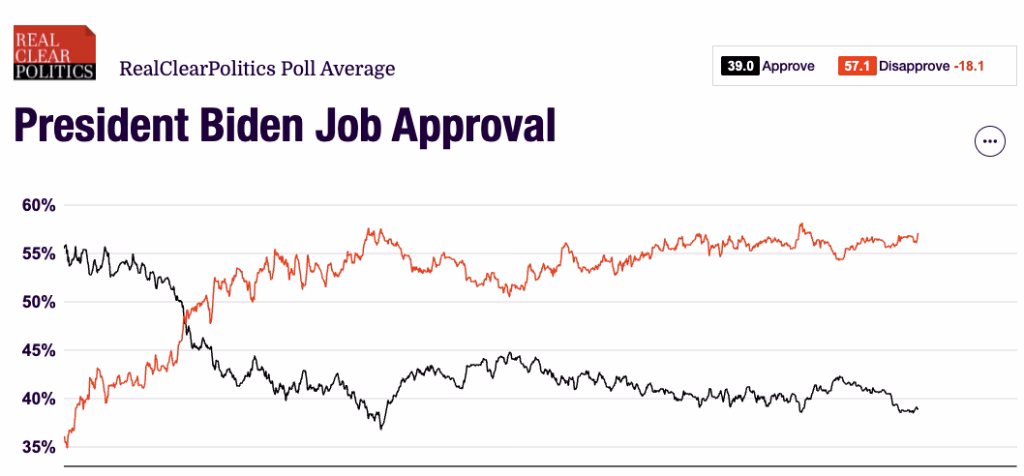
His honeymoon period was a bit longer than Trump’s, presumably a function of his campaign’s focus on bringing the country back together rather than simply energizing the base. But his fluctuation was roughly similar to Trump’s. It may simply be that, in our hyperpartisan, hyper-sorted era, there’s both a ceiling and a floor for presidential approval.
Agreed. Trump has a solid core of true believers, his personality cult. They will always find a way to justify anything he does. For Democrats there is not a cult of personality but I think it’s rather a combination of supporting party principles, even when poorly performed by its current leaders, and not wanting to in anyway support Repubs.
Steve
@steve222:
There was a lot of talk about Dems seeing Obama as the Second Coming. But from what I could see, almost all of that talk came from conservatives, projecting. There do seem to be some basic asymmetries between the parties.
@steve222: @gVOR10:
We don’t do cults of personality with the possible exception of Beyoncé.
As I’ve been deluged by clickbait headlines and thumbnails involving words like ‘plunging’ and ‘cratering’ I’ve believed the only number that matters now is that 45% floor.
@steve222: “They will always find a way to justify anything he does”
Many of them have invested themselves personally in him for nearly a decade, and are not about to acknowledge they were wrong.
@steve222: Keep in mind that Trump’s support is also helped greatly by the media bubble that many of his supporters are in. If you’ve been watching Fox News for the last 20 years, you aren’t exactly getting the full, true story. Other newer media sources are even more like propaganda, and social media gives them a nice feeling of bubble-comradery.
@Eusebio:
Or *can’t* because their entire world view is anchored in those beliefs
I’ve said it before; I believe that Trump’s base support always puts him at about 40%, so I don’t get too excited when his approval ‘is down to 40%!!!’
I believe that if his polling ever consistently goes to 33% across a wide range of issues then he might have … might have … serious political problems.
@al Ameda: I dont think that even at 33% he will change or have many problems. Even at that number he would still have majority support in the GOP and especially among the base, the people who vote in primaries. You arent really going to see any Repub congress critter grow some balls unless Trump’s number plummet into the 20s. Maybe some senator in a swing state might gently reproach Trump.
Steve
I wonder whether Republiqan voters are ignorant or foolish enough to actually approve of El Taco, or whether by now many, if not most of them, feel that disapproval of any Republiqan president, or El Taco in this case, is un-American, and maybe even worse than approval of a Democratic president.
@steve222:
You know, I was going to say 27%, which is the ‘crazification factor, was the floor, but I thought that was too pessimistic. But, generally, I’m with you on this. Republicans are getting what they want from Trump, exactly what they voted for.
@al Ameda:
The problem with the crazification factor–a term which I generally like–is that it omits the context of the situation that inspired it, the Illinois Senate race in 2004 where Obama absolutely crushed Alan Keyes, but Keyes still got 27% of the vote.
The problem with the term is that it acts like that 27% is some kind of magic number we see all across our politics, when there’s really no evidence of that. Illinois is generally a very blue state which occasionally elects Republican Senators. Keyes did a lot worse than Republicans usually do in the state, but Republicans usually don’t win. It’s not a good analogue for the country as a whole. Historically presidential candidates have never gone anywhere near as low as 27%, outside of a few elections with a significant third-party vote. The floor is always much higher, especially today.
And that’s simply talking about the presidential vote, whereas here we’re talking about approval ratings–not the same thing.
In any case, Trump’s approval ratings have never hit the 20s in either term thus far, which means that he seems to have a higher floor in those ratings than either of the Bushes, Jimmy Carter, Nixon, or Truman. Where he has performed historically poorly is (a) in his average approval rating during his first term (b) in the distance between his approval and disapproval ratings at certain points.
Crazification should be seen as a variable, not a constant.
On the positive side, Kurt Weyland in Democracy’s Resilience to Populism’s Threat talks about successful authoritarians having 70%+ support. Trump is a long way from that, and not improving. Weyland sees Italy’s Berlusconi as the likely model. Able to become prime minister three non-continuous times, unable to seal the deal to stay in office, but doing a lot of damage.
@Kylopod:
I agree with you, and for the record I’ve never viewed ‘Crazification’ as anything more than a fun-to-consider variable.
The further we get into the Trump Conspiracy Cesspool Years, I am more inclined to think that 27% is a pretty fair measure of Crazification. I also believe that the subset of Independents does not include Crazification which these days is largely in the domain of the Republican Party – perhaps a 22% GOP and 5% Democrat split?
For years I’ve thought that most Independents were Republicans who were avoiding the brand. Now perhaps Independents describes Democrats who are avoiding the brand.
@al Ameda:
I think the research has suggested the amount of D-leaning indies and R-leaning indies is roughly similar, though of course that’s subject to change over time.
Contrary to popular belief, indies don’t always vote for the winning candidate. In fact, in the 21st century so far, the Republican nominee has won the indie vote exactly three times (2000, 2012, and 2016), the Democratic nominee four (2004, 2008, 2020, and 2024). It’s hard to discern any pattern there. I’d also warn against assuming that these shifts are primarily due to individual indie voters shifting in their party preference from one election to the next. I agree with you that some of it is due to changes in who identifies as an indie, but to some extent it’s affected by which types of indies turn out in any election. According to the Roper’s exit polls they backed Trump in 2016 (+4), then shifted strongly against him in 2020 (-13), then in 2024 shifted somewhat back toward him while still voting against him (-3). But I suspect these swings were less about indies souring then de-souring on Trump than a reflection of increased and decreased turnout among D-leaning indies.