So far I have seen two articles indicating that this is not the case. The first is from Robert Higgs who is associated with the Independent Institute and has very strong libertarian views (so strong he might even hold anarcho-capitalists views). The second is from Alan Reynolds at the Cato Institute. Both rely on Federal Reserve data (the link goes to the page Reynolds used). There is just one problem, they appear to be wrong.
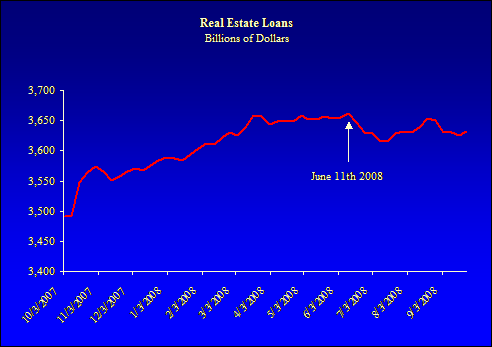
I took one of the time series that Reynolds noted, Real Estate Loans by U.S. commercial banks and graphed the weekly numbers. Here is the graph,

It looks pretty obvious to me that since late spring/early summer the growth of credit has been rather flat. After June 11th the trend is decidely negative. Yes there was a surge at the mid to end of July, but overall things look rather disappointing compared to the early half of the graph. If the trend up throgh March 26th were continued to the last date in the dataset we’d have Real Estate Loans of $3,777 billion. Instead we have $3,632 billion which is about 3.8% lower. Another way to look at it, prior to June 11th the average weekly change in real estate loans was about $4.77 billion, after that point the average weekly change was $-2 billion.
I don’t know about you, but that looks like there is less credit available than there would have been absent the current financial crisis. Further if you were to look at things like the LIBOR and TED they indicate that there is indeed less liquidity in the market than previously (link admittedly a bit old).
Market measures: Two market indicators showed the price of borrowing for banks remaining high – a sign that banks are nervous about lending to other banks. These indicators are “at levels that indicate the money markets are still locked up,” said Van Order.
One gauge, the “TED spread,” showed high prices of loans between banks. The TED spread measures the difference between three-month Libor and the three-month Treasury borrowing rates and is a key indicator of risk. The higher the spread, the bigger the aversion to risk. On Tuesday, the spread retreated to 3.04%, after surging to 3.53% – its highest level in more than 25 years.
On Sept. 5, the TED spread was only 1.04%.
Furthermore, the difference between the Libor and the Overnight Index Swaps rose to a fresh record high 2.46% from 2.20% Monday, according to data reported by Bloomberg.com. The Libor-OIS “spread” measures how much cash is available for lending between banks, and is used by banks to determine lending rates. The bigger the spread, the less cash is available for lending.
The Libor, or the London interbank offered rate, is a daily average of what banks charge other banks to lend money in London. Larkin compared the Libor “the dial on the engine of the car,” showing how much power the economy has. “And right now it is indicating that the car is severely overheating.”
We have seen from multiple data sources indicators that there is indeed less credit than there previously was, credit is indeed drying up.