A Business Insider story claims that, “Only one group of Americans has become less accepting of homosexuality in the past 2 years.” That’s not only untrue (several groups have had statistically insignificant drops) but misses the point.
On Monday, the Pew Research Center released the results of a new survey on how Americans view homosexuality.
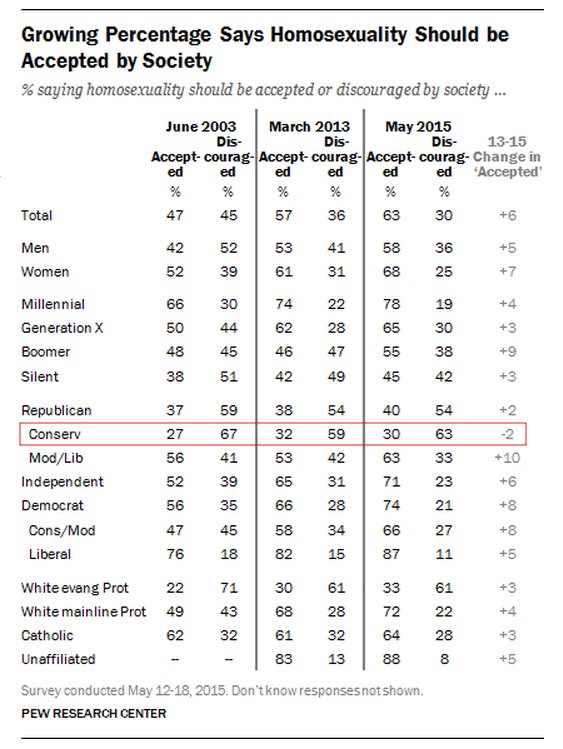
One question asked respondents whether homosexuality should be accepted or discouraged by society. Pew broke down responses to this question by a number of demographic, political, and religious factors and compared results from this year’s survey to a similar survey from March 2013.
In almost every one of the groups Pew broke out, the percentage of respondents who said homosexuality should be accepted increased over the past two years. This was the case for men and women, each of the generational cohorts Pew looked at, and each of the four major religious groups in the breakout.
The only group that had a decrease in the percentage of respondents who believed society should accept homosexuality was conservative Republicans. Each of the other political subgroups, including moderate and liberal Republicans, saw an increase in that percentage between March 2013 and May 2015.
That self-identified conservative Republicans might be experiencing a backlash against the rapid changes in gay acceptance wouldn’t be surprising. But it’s not evident in the data nor true over a meaningful time period. Here’s the BI chart:

So, by focusing on one question from a larger survey and isolating the two-year change, we single out conservative Republicans. But a two point change is well within sampling error for the poll—much less a small subsample. Further, even that group is up over the 2003 poll. And moderate/liberal Republicans are up 10 points since two years ago after having “dropped” three points over the previous nine year period.
Looking at the broader Pew poll, though, the results are almost universally positive on the issue.
A 57% majority of Americans now favor allowing same-sex marriage and 39% oppose. As recently as five years ago, more opposed (48%) same-sex marriage than supported it (42%).
Yet even as support for same-sex marriage has increased among nearly all segments in the public, some groups remain broadly opposed to gay marriage.(See detailed demographic breakdowns and long-term trends on same-sex marriage.)
The Pew Research Center survey, conducted May 12-18 among 2,002 adults, finds that partisans are as divided on this issue as ever: Today, 65% of Democrats and an identical percentage of independents favor gay marriage; only about one third (34%) of Republicans do so. Growing shares of all three groups support same-sex marriage, yet the differences between Democrats and Republicans are as wide today as they were a decade ago.
The trend has been positive and rapid over the course of the survey period. And the pushback isn’t limited to conservative Republicans; it includes groups you might not expect.
Agewise, support for gay marriage is growing rapidly for all groups—except the Boomers, who have “dropped” since the previous poll. Moreover, the subgroup of Boomers where support has dropped are those that lean Democrat–it’s actually increased among Republican Boomers! As with conservative Republicans, this is within sampling error.
Indeed, liberal Democrats are the only partisan group where support for same-sex marriage has decreased since the last survey. Conservative Republicans have sen an uptick–although they’re ever so slightly down from where they were four years ago.
In terms of religion, support is up everywhere but among Catholics and Black Protestants. It’s up considerably among White Evangelicals!
Given that the only drops in support for gays and gay marriage comes in tiny subgroups and that said drop is within the margin of error in each case, we should probably ignore said “drops.” The trend is in one direction and stark.