Yesterday, Dave Schuler came across an article citing Thailand as a “poor country” and objected:
With a median household income of around $7,000/year, I would characterize Thailand as a “middle income” country. I think that countries with median household income below about $7,000 are low income (India, Egypt), countries with median incomes from $7,000-$15,000 (Russia, China, Brazil, Argentina) are middle income and countries with median household incomes greater than $15,000/year are rich countries.
Offhand, those thresholds strike me as both too low and inadequate. At a minimum, purchasing power parity would need to be brought into it.
The World Bank, the premier intergovernmental organization for international development, “divides the world’s economies into four income groups: high, upper-middle, lower-middle, and low.” And Dave’s instincts aren’t far off:
The income classification is based on a measure of national income per person, or GNI per capita, calculated using the Atlas method. In 1978, the first World Development Report introduced groupings of “low income” and “middle income” countries using a threshold of $250 per capita income as threshold between the groups. In the 1983 WDR, the “middle income group” was split into “lower middle” and “upper middle” groups, and in 1989 a “high income” country definition was introduced.
Since then, the thresholds to distinguish between the income groups have been adjusted for prices over time. As of 1 July 2019, low-income economies are defined as those with a GNI per capita, calculated using the World Bank Atlas method, of $1,025 or less in 2018; lower middle-income economies are those with a GNI per capita between $1,026 and $3,995; upper middle-income economies are those between $3,996 and $12,375; high-income economies are those with a GNI per capita of $12,376 or more.
Here’s a plot of the countries Dave mentions over time, plus the United States:

As you see, only India and China among them have been “low income” during the last three decades and none of them have been “low income” since roughly 2008. Thailand has been in the “middle income” categories throughout the period. And, contrary to perception, Russia and China are both quite close to “high income” status—which Russia briefly achieved during the last energy price boom. Yet, the United States is in its own stratosphere despite Russia and China routinely being touted as “peer competitors” in the national security space.
The good news is that there are far fewer “low income” countries than there were a generation ago.
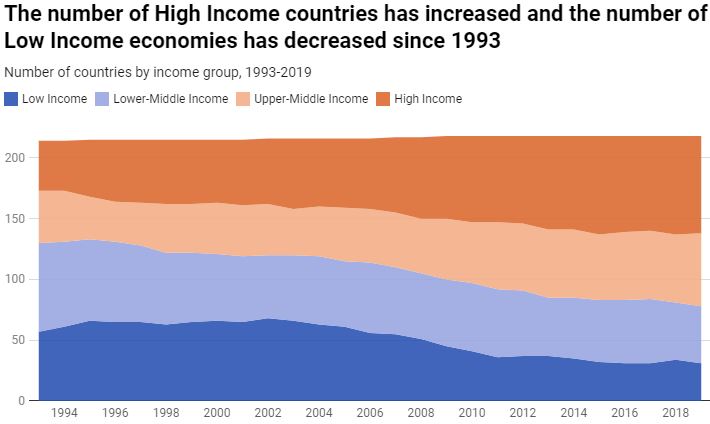
Because most parts of the world have experienced considerable economic growth in recent decades, and the classification thresholds are held stable in real terms, there are now fewer low-income countries and more countries have gained middle or high-income status. Just since 2003, the number of low-income countries has nearly halved, declining from 66 to 31 in 2019. The number of high-income countries is currently 80, up from less than 50 in the 1990s. The number of middle-income countries is 107 (60 UMICs and 47 LMICs) and has not changed much as countries have transitioned both in and out of this group. The chart below summarizes the number of countries in each group over time.

The linked version is interactive but the trends are unmistakable: the “low income” share is much smaller and the “high income” share is much higher.
And, what’s true of countries is also true of people:
The changes are even starker when looking at the share of the world population that live in each type of countries. The vast majority (75 percent) of people currently live in countries defined as lower or upper-middle income countries. As large countries, such as India and China, have transitioned from low income countries to middle income countries, the population shares have shifted dramatically. In the 1990s, more than 6 in 10 people of the world’s population lived in low-income countries, while today it is just about 1 in 10.
Of course, income inequality within states isn’t addressed here. Wealth may very well be concentrated among a relative handful of elites.
Beyond that, my instinct remains that $1,026/person is an absurdly low threshold to escape “low income” status and $12,376 is an absurdly low threshold to be declared “high income.” (Granted, those are 2019 numbers.) Indeed, $12,760 is the current poverty threshold in the United States. The World Bank, though, anticipates that objection:
With only a small share of the world currently classified as “low income” and as the thresholds not having changed since 1988 (in real terms), critics argue that these income groups are losing relevance, and are somewhat arbitrary and dated.
There are many ways of grouping economies and organizing analysis of development data, and the income classification is only one of many. Yet, the absolute nature of the thresholds, and the long history of the classification scheme, provide a useful way of tracking progress over time. And analysts can always select and analyze data for custom groupings using data from our Databank.
It is important to emphasize that the income classifications are intended to aggregate and analyze data for groups of similar economies. Among other things, income classifications are used in the WDI and SDG Atlas to shed light on the following questions:
*Which type of countries have more weight in the global economy?
Which is fair enough. As with many questions posed in social science, the usefulness of the definition really depends on what question you’re trying to answer.
My instincts on the income thresholds are based on a sense of what sort of lifestyle an individual earning that amount could live in a developed country. It may well be that $1026 goes a decent way in much of Egypt—although it certainly wouldn’t in Cairo.
But even using the World Bank’s own criteria, surely India carries far more weight in the global economy than Thailand or Egypt?