 One of the foundational elements of a democratic system is the connection between voters and office-holders (as illustrated by this simplified model from Taylor, Shugart, Lijphart, and Grofman 2014:10):
A key aspect of this model is the assumption (which is fundamental to democratic theory) that accountability is maintained by electoral competition in which the voters can reward or punish office holders and political parties. This accountability loop is a means of communicating, albeit imperfectly, popular policy preference to those who sit in government and make said policy. The exact nature and quality of this feedback loop varies across different democratic cases and is predicated on the nature of the institutions of democracy in those given cases.
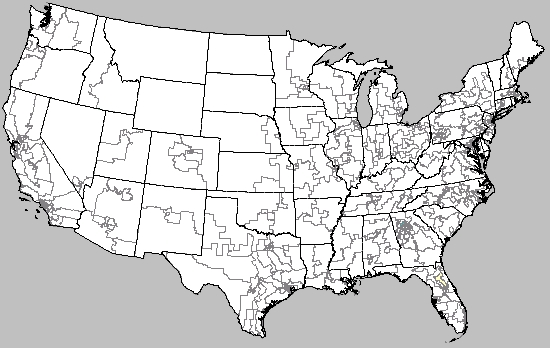
One of the reasons I have often written on issues like competiveness and representativeness within American democracy is because those are issues that influence the quality of the feedback loop in question. Along those lines, I noted the other day that the Alabama ballot in my portion of the state was marked by a large number of unopposed candidates (including, somewhat remarkably, for US Senate). Along these lines I was curious as to how many seats in the US House races were uncontested. So, I poked through Ballotpedia and CNN and constructed the following table. I have identified two categories of contest: 1) those where the seat was uncontested (including a handful that had write-in opposition), and 2) those where was no major party opposition. It should be noted that third party/independent competition is at least nominal competition, but in the US system having no major party opposition is tantamount to a non-competitive district given the track record of third parties. More importantly for my purposes here it means one of the two major parties decided that the seat was not worth even token participation.
(Note: I did not include California, Louisiana, or Washington in this count because of the nature of their two-round systems which are not, by the way, primaries no matter what they are called).
The results: 32 members of the House had no competition (8.0%) and 28 had only non-major party opposition (6.4%) for a combined 14.4% of the districts being so lopsided that one of the two major parties did not even offer token competition. While these are not overwhelming numbers, they are also not insignificant. Some states are especially problematic (e.g., Massachusetts and Texas).

The table needs another two categories to get a full picture: non-competitive seats with two major party candidates (the vast majority of all seats) and another with truly competitive elections (a handful of all seats).
Now, this is one election (and as I noted the other day, one should not judge an election in a vacuum). However, without looking I am confident that this is not an atypical pattern. While one cannot draw specific conclusions from this table, it does make for an interesting observation about a specific type of noncompetitive districts.