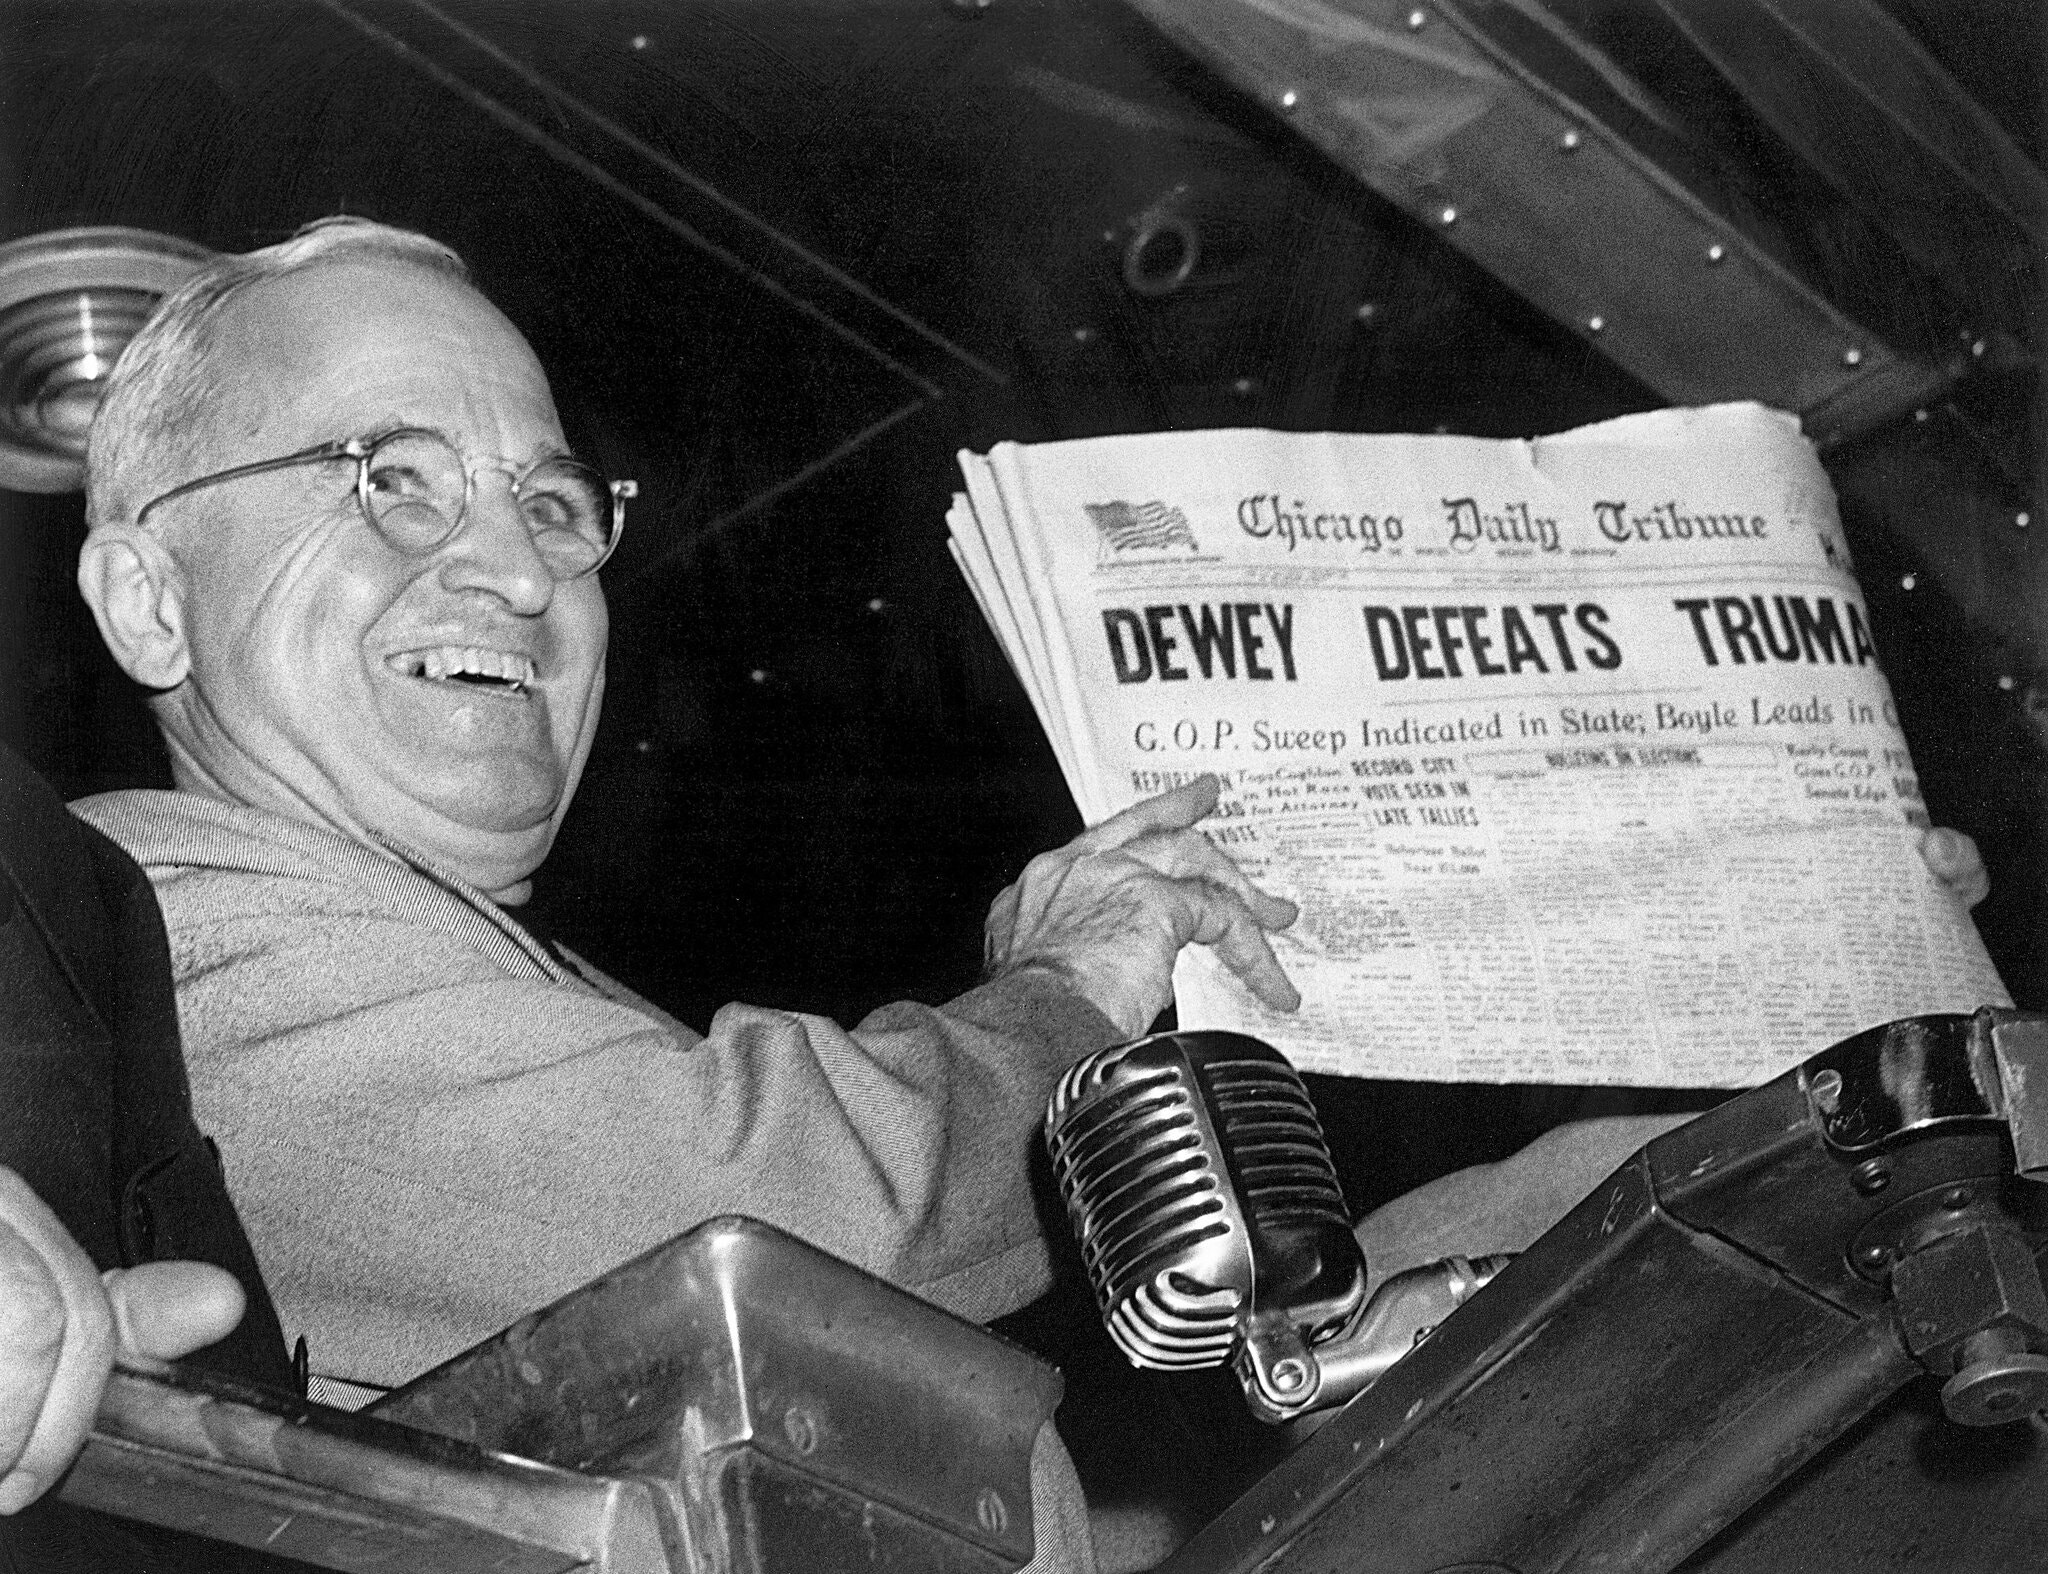

I used the above image to make a point about what truly catastrophic polling error looks like as a reminder that such disastrous outcomes are rare. Moreover, the above was from the very earliest days of polling and an illustration of why sampling is so important. It was also from a media era in which print was king, and editors had to make decisions about content in ways that stopped being relevant in the live TV era, let alone with the advent of the internet. All of this is prologue,* of course.
Last week I noted the following from the NYT which I have only now had time to really look at: The ‘Red Wave’ Washout: How Skewed Polls Fed a False Election Narrative.
Let me cut to the case. The story is about how partisan polling organizations, like Trafalgar Group, were showing a much more Republican environment than were non-partisan polling groups. This led, understandably, to a lot of Democratic candidates being spooked and altering their campaign behavior (often by more spending) and, especially, for the national news media to flog the Red Wave narrative.
Now, there was some reason to assume that maybe pollsters with GOP leanings better understood their electorate, especially since 2016-onward that electorate has caused mainstream pollsters some difficulties (some of this is noted below). But it is also true that partisan pollsters have some incentive to produce results that are appealing to their team (see, for example, the Rasmussen Twitter feed).
As a basic principle, I trust non-partisan organizations over those with stated partisan leanings. And the NYT piece illustrates why. For example:

Neither set of pollsters was perfect, but +1.9 is a lot farther away from the result (+14.5) than is +8.5. (Although to a point that I elaborate on below, we collectively get a lot less worried about gaps in polling versus results when the winner we expect to win, wins. Only the true polling professionals get worried about why there were other errors).
Nonetheless, since the news (of all stripes and modalities) is driven by an entertainment paradigm, rather than one truly grounded in information and analysis (although the mix of those emphases varies from outlet to outlet) the narrative was a Red Wave is coming!
But as I noted right after the results were posted, the overall outcomes were not as surprising as the Red Wave narrative suggested.
What were some key, long-term expectations going into this election?
- Republicans would almost certainly gain seats and win the House. I noted this in a January 2022 post: 2022 is a Midterm Year. (And back in August, CBS projecteda seat count not unlike what we might end up with).
- That the map favored Democrats more than previous maps. I noted this back in April: A “Fairer” Map for the 2022 House? Again, it is worth stating that district lines are the single most significant variable in understanding our electoral outcomes. Yes, other things matter, including candidate quality, but not anywhere near as much as the Horserace Narrative suggests.
- The Senate was likely to come down to AZ, GA, NV, and PA. This was noted in July: Looking to the Senate Elections.
I would note that a lot of concern was understandably linked to state-level executive races and the concerns over election denialism. But I would also note that most polling discussions were about Congress. And I still maintain that while Republicans did do worse than they could have, the outcome is not that off the mark that seemed likely to a dispassionate assessment made before the elections itself.
I think a major consideration here is that there are really at least two distinct issues here (really, more, but these two are key). One is the empirical accuracy of the polling itself, while another is the journalistic narrative that emerges around it. I think, for example, that discussions about recent polling error are not just an empirical issue of what the polls were incorrect about, as much as it is retrospective thinking about what the media narrative (and voters with rooting interest) had in the outcomes.
Take, for example, 2016. The polls suggested a Clinton win, but instead, Trump won. So, obviously, the polls were crazy wrong, right? It sure feels that way, especially to Democrats.
The final popular vote percentages for the top-two voter-getters in 2016 was HRC 48.18% and Trump at 46.09%.

The final FiveThirtyEight polling average had HRC at 45.7% and Trump at 41.8%.

Now, that is a miss of 2.4 points for HRC and 4.29 points for Trump. These are not insubstantial nor unimportant errors, especially not the Trump side, but likewise this is not “Dewey Defeats Truman.”
The polls showed HRC had more national support than Trump did, and that was correct.
Indeed, I still think that a huge amount of anger directed that the polls post-2016 was as much displaced anger that should have been leveled at the Electoral College as much as anything else (along with a lot of people who simply don’t understand probabilities).**
So, yes, 2016 polling underestimated Trump’s support in the population, but that polling was not the Hindenburg of polling. (Pew Research offered some ideas about Why 2016 election polls missed their mark in a piece at the time).
But, again, if we elected the president on the basis of the popular vote, our shock over Trump getting 46.09% of the vote instead of 41.8% would have been blunted. It was the institutional parameters that translated votes into office that ended up making the real difference.
Put yet another way, I am of the view that a great deal of “the polls are crap!” and/or general anxiety about the polls is driven not by the 5-point error for the Trump vote as much as it was by Trump winning, which was a function of the Electoral College. Because, again, the polls still properly predicted the popular vote winner, getting her total reasonably on the mark.
Now, if one is concerned about the actual accuracy of the polls, then yes, the 5-point needs to be accounted for. And, indeed serious pollsters are constantly trying to figure out how to refine their sampling processes and their turnout models. But, I cannot stress enough that most people (the same ones who discounted an almost 30% chance of a Trump victory) really aren’t all that worried about the math, but rather about how they feel about the outcomes.
To shift to 2020, Biden won 51.31% of the popular vote, and Trump won 46.86%. The final polling average at FiveThirtyEight had the numbers at Biden with 51.8% and Trump with 43.4%. Again, Trump’s support was underestimated, although in this set of polls by 3.46 points. 2016, 2020, and also 2018 provided real reasons to ask if Trump voters were somehow systematically being undercounted, but the notion that the polls are worthless does not hold up to empirical scrutiny.
The part that needs scrutiny is the media narrative. For example, 2018 was so heavily touted as a Blue Wave that the fact that Democrats won, but didn’t win dramatically enough, created the perception in some quarters that 2018 was a disappointment. Likewise, as per the cited article at the top, since some polls (but only some) predicted a Red Wave that did not appear we end up with a specific narrative about the 2022 midterms that I don’t think should have been propagated in the first place. (Realy, the obsession of late in the mass media with “waves” is part of the problem–especially since it is a “know when you see it” kind of term, rather than one that has a clear definition).
I continue to think that a major problem of the entire polling narrative, including analysis by very smart people who know more about polling than I ever will, is that it ignores how much electoral outcomes in the United States are essentially predetermined. The projected number of competitive seats was always a mere fraction of the House. And, likewise, most Senate contests are also noncompetitive.
Further, a flaw in political journalism is the propensity to want drama, and therefore to heighten any story that makes competition more likely or, really, anything that gets eyeballs and clicks. Beyond that, consumers of election news are not dispassionate observers, but rather interested parties with a rooting interest. This, too, skews how we all look at the news.***
The NYT piece that inspired this post notes at least in part how the narrative was formed:
Traditional nonpartisan pollsters, after years of trial and error and tweaking of their methodologies, produced polls that largely reflected reality. But they also conducted fewer polls than in the past.
That paucity allowed their accurate findings to be overwhelmed by an onrush of partisan polls in key states that more readily suited the needs of the sprawling and voracious political content machine — one sustained by ratings and clicks, and famished for fresh data and compelling narratives.
The skewed red-wave surveys polluted polling averages, which are relied upon by campaigns, donors, voters and the news media. It fed the home-team boosterism of an expanding array of right-wing media outlets — from Steve Bannon’s “War Room” podcast and “The Charlie Kirk Show” to Fox News and its top-rated prime-time lineup. And it spilled over into coverage by mainstream news organizations, including The Times, that amplified the alarms being sounded about potential Democratic doom.
Quite frankly, I think that the growth over the last decade-ish of poll-driven media narratives**** has incentivized such an appetite for polls that it has made critical evaluations of specific polls to wane. I am just predisposed to discount partisan polls, regardless of the partisan direction. But when the narrative machine must be fed, media outlets are less discerning.
The virtual “bazaar of polls,” as a top Republican strategist called it, was largely kept humming by right-leaning pollsters using opaque methodology, in some cases relying on financial support from hyperpartisan groups and benefiting from vociferous cheerleading by Mr. Trump.
Yet questionable polls were not only put out by Republicans. The executive director of one of the more prominent Democratic-leaning firms that promoted polls this cycle, Data for Progress, was boasting about placing bets on election outcomes, raising at least the appearance of a conflict of interest.
Other pollsters lacked experience, like two high-school juniors in Pennsylvania who started Patriot Polling and quickly found their surveys included on the statistical analysis website FiveThirtyEight — as did another high school concern based at Phillips Academy in Andover, Mass.
At any rate, a longer view is also often missing from the media narrative:
Nationally, there was an uptick in support for Republicans in early autumn. It surfaced in surveys by firms across the industry, according to an analysis by Charles Franklin, the director of the Marquette Law School Poll — a fact he said had been overlooked in postelection criticism of red-wave polling. A New York Times/Siena College poll in mid-October showed Republicans with a three-point lead nationwide, up from a one-point Democratic advantage a month earlier.
Indeed, Republicans won the national popular vote by three points, measured by the postelection tally of votes in House races. And they made gains in unlikely states like New York, even as Democrats prevailed in many of the races that counted most.
It is worth remembering that the aggregate national polling tends to be more accurate, while state-level races tend to have wider margins of error due the fact that those polls often having smaller sample sizes.
statewide polling in individual contests that would determine control of Congress had magnified effects, seeming to reinforce the idea of a red wave sweeping the country — which in turn reduced what proved to be a very complicated election to an oversimplified idea.
At any rate, my overall point is that polling is not as bad as many seem to think is the case and that expectations shape perception more than math does. Moreover, the media, ever in search of eyeballs, exacerbates the tendency of partisans to view every single piece of information with emotions rather than reason.
And the partisan nature of the eyeballing hunting in the current media environment drives decisions as well:
Surveys creating the misimpression of a red wave proved particularly useful to right-wing media outlets. Among their audience, evidence pointing to Republican victories and Democratic defeats was in high demand — particularly on Fox News.
The network’s own polling unit, respected throughout the news industry for its nonpartisanship and transparency, was not detecting a Republican wave. But in September, Sean Hannity’s prime-time show began showcasing the pollsters Robert Cahaly of Trafalgar and Matt Towery of InsiderAdvantage, who predicted that Republicans would take the contests in Pennsylvania, Arizona and Georgia, among other places.
Unmentioned was that the Fox News Poll, amply covered in the network’s straight-news programming, showed all those races leaning Democratic.
[…]
Mr. Hannity, on his program, noted that he had emphasized to his audience the tight margins in competitive races. Fox News did not comment on its hosts’ use of polling.
But history points to a likely explanation: ratings, which determine advertising revenue and have tended to rise and fall with Republicans’ prospects.
“The culture of programming does not take kindly to narratives of ‘we’re behind’ or ‘we’re losing,’” said Jason Damata, the founder and chief executive of Fabric Media, a media and advertising consultancy. “Fox has a profound understanding of what’s going to keep audiences coming back and being engaged.”
Sigh. Infotainment gonna infotain.
In 2012, Fox News ratings soared as its hosts predicted Mitt Romney would defeat President Barack Obama, then plummetedwhen he did not. In 2020, its ratings suffered briefly after it was the first news organization to declare Mr. Biden the winner in Arizona.
By then, the Fox News audience could go elsewhere, and some did, buoying much smaller rivals at Newsmax, OAN and an expanding array of right-wing websites, online shows and podcasts.
Like Fox, those internet-based outlets relied on pro-Republican content to build their audiences. Unlike Fox, they were not tethered to news operations that subscribe to traditional journalistic standards.
This year, many presented the “red wave” as an absolute certainty.
This is, of course, dangerous as it just helps different sets of citizens to live in their own realities, no matter how ill-defined that “reality” may be.
And it isn’t new, as long-time readers may recall the whole “unskew the polls” bit back in 2012. As I wrote in September of 2012(!):
I know that I have written a lot about the polls of late and the phenomenon I refer to as “poll denialism” but I think that it is indicative of an ongoing problem for the Republican Party and its supporters: the creation of an information bubble that makes not only clear assessment of their candidates and positions difficult, but denigrates our government’s ability to govern.
Sadly, the last decade has not improved in these areas. Indeed, they have gotten worse.
Of course, above all else, I would love it if the prevailing news discussion of elections hammered home a bit more about how so many of our elected offices are selected in non-competitive races (with all the significance thereof) and that they had to worry less about entertaining people.
But, of course, I am aware of the efficacy of wishing.
(I would recommend reading the NYT piece in full, which is long and detailed and I have not fully covered it here).
*Any reference to a prologue always makes me think of the British comedy, Up Pompeii!–which is likely a ridiculously obscure reference, save to perhaps our handful of British denizens and/or persons of a certain age watching British comedies on PBS stations across the land back in the 80s.
**After all, the FiveThirtyEight model gave Trump 28.6% change to win. That is a significant chance! But too many people seemed to think that HRC’s 71.4% chance was a sure thing. It wasn’t. That’s not how probability works. Now, granted, the models that showed a 99% chance for HRC made big mistakes.
***Consider the following. How do you react to watching a sporting event when you care passionately about one of the teams versus how you observe a game wherein you have zero actual rooting interest?
****Polls have been important for a long time, see, again, the photo at the top. But the usage of polling averages, forecasting models, needles and the like is a more recent set of phenomena.