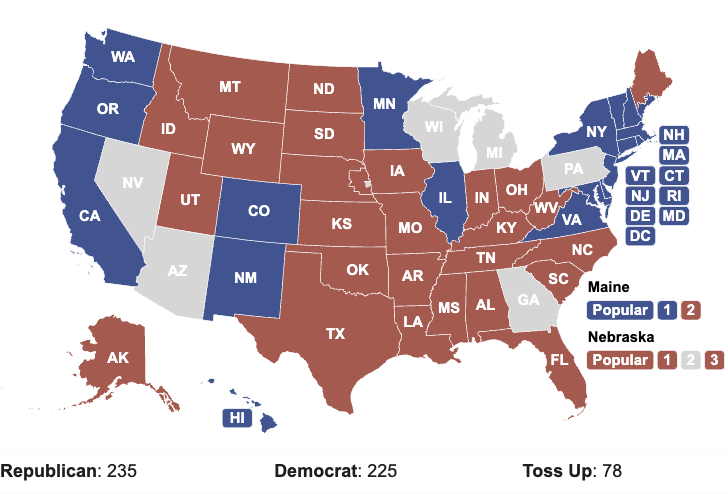

Above is Taegan Goddard’s Electoral Vote Map, which is interactive at the link. Note that this interactivity is limited to only six states, as he considers the others non-competitive based on polling and past results.
In recent elections, there have been a dozen or more truly competitive battlegrounds which could result in many various paths to 270 electoral votes.
That’s changed in recent years as political polarization has increased, resulting in red and blue strongholds with bigger victory margins.
For instance, despite the narrow popular vote margin in 2016 — see the 2016 election map — more than two dozen states were decided by margins of 15 percentage points or more.
In 1988, when the popular vote margin was seven percentage points, there were just 17 states which were won by such big margins.
It’s noteworthy, too, that 1988 was the last election in which California, which had long been a “lock” for Republicans (including five times for native sons Richard Nixon and Ronald Reagan), voted for the GOP.
I’ve played around with the map a bit and started by giving the GOP (presumably Trump) Arizona and Georgia and giving the Dems (presumably Biden) Nevada, assuming a reversion to the norm. That puts it a Republican 262, Democrat 231, Toss Up 45. Which means that Biden would need to run the table in Wisconsin, Michigan, and Pennsylvania. If Trump wins any of them, he’s President.