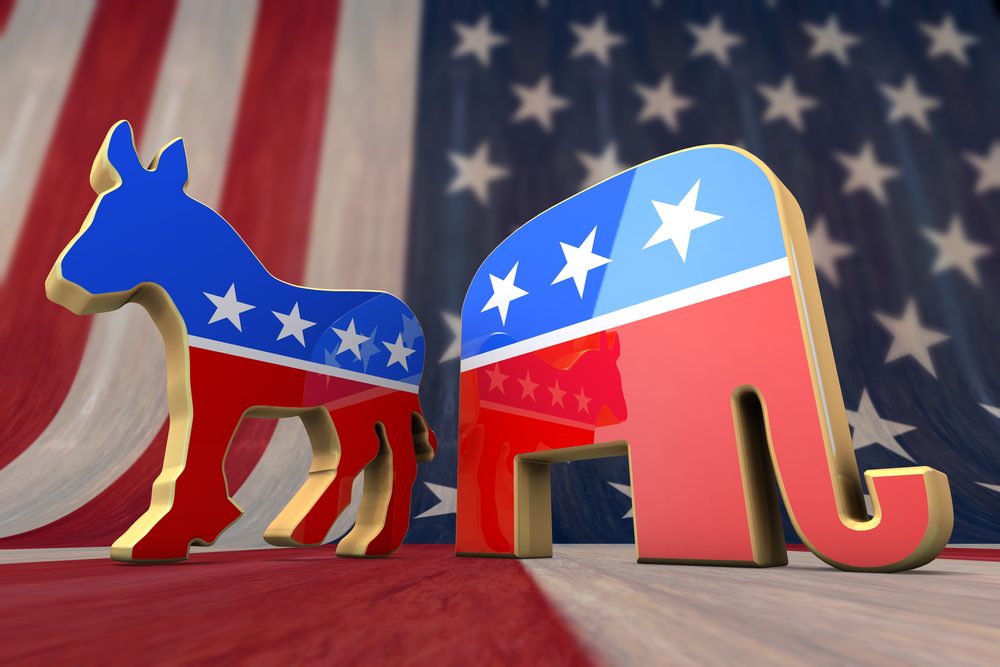

Gallup has the party ID stats for 2021 with a dramatic headline that I think over-emphasizes a not especially surprising finding: U.S. Political Party Preferences Shifted Greatly During 2021.
Let’s start with the buried lede, which is that overall the numbers are stable within long term patterns:

Over the last decade, the stability is actually quite striking (and even the pro-D bump in the mid-to-late-00s is hardly dramatic). Really, 2021 is essentially the same as 1991.
Still, it is true that within 2021, the Democrats took a dive. Here are the quarterly numbers:

What immediately strikes me looking at these numbers is that they largely track Biden’s approval rating (as the write-up acknowledges). It also tracks with the discussion we have had here at the site about why the party in the White House does poorly in mid-terms: that party will always disappoint some segment of the population.
Here’s the 538 average as of today:

It stands to reason the party identification would track along with presidential approval. Moreover, it also stands to reason that in the first year of an administration that there would be a shift downward in both approval and, as a result, party ID. After all, when you only have two operative choices, where else are disaffected and disappointed people going to go save to the other party? People don’t want to identify with that which they disapprove.
The funny thing is that last year there was also a shift in party ID over the year, but the headline read Party ID Average for 2020 Winds Up Similar to Prior Years (which was a true headline for 2020 and for 2021–and, as noted above, basically every year since 2011, if not in many ways since 1991).
Here was last year by month instead of by quarter:

I mean, comparing January 2020 to December 2020, the Reps lost 8 points to the 9 points the Dems lost this year–making the two years rather similar. Perhaps there is a reason that looking at yearly averages makes more sense. This is yet another in a legion of examples wherein choices of headlines can radically influence how people read stories.
At any rate, here is the breakdown for R, D, and I through 2021, which also shows a fairly stable pattern for the last decade-plus:

Of course, I would be remiss in not noting that while a plurality of Americans self-identify as “independents” they vote with one of the two mainline parties in mostly consistent ways election after election. While I do think that a different set of electoral rules would birth new parties in the US over time, those who look at these numbers and think that there is a new party that can be carved out from that 42% under our current system are simply incorrect (I am looking at you, Andrew Yang).